Campania Climate Hub
The Campania Climate Hub is the climate service on Dataclime developed for the Campania Region to interactively explore the regional climate framework and support the planning of climate change adaptation policies and interventions. The service collects a set of climate indicators selected through co-design with regional offices, consistent with the national adaptation guidelines.
Objectives
- Understanding how the climate is changing in Campania.
- Evaluating the evolution of extreme events relevant to territories and sectors.
- Supporting analysis and technical documents with downloadable maps and data.
The service allows users to explore dynamic maps at the regional scale, consult results at the provincial and municipal scales (ISTAT base units), select indicators, periods and administrative levels, and download outputs in CSV/PNG.
All data used in this product comes from public and open access sources. In each specific section you can consult the terms of use of the different data sources used.
Complete ReportCMIP6 climate projections
This section illustrates climate variations for the Campania region as of 2050, processed using statistical downscaling, a method that provides more detailed local projections from global-scale climate data. The process was applied to a selection of Global Circulation Models, using the Copernicus European Regional Reanalysis (CERRA) with a resolution of ~5.5 km and considering the IPCC scenarios SSP 3-7.0 and SSP 1-2.6. The projections describe how the future climate could evolve through the analysis of climate indicators, based on different scenarios reflecting possible global pathways in terms of commitment to combating climate change. The maps show the expected climate variations, calculated as the difference between the average values of the selected indicator in the future period (2036-2065) and the reference period (1991-2020), taking into account the selected IPCC scenario.
Filters
Model Data
CMIP6
CMIP6
Download the selected map in Zip format.
Accumulated Precipitation in wet days (PRCPTOT)
(PRCPTOT)
Daily precipitation sum in wet days (days with precipitation greater than or equal to 1 mm).
Season Yearly
Measurement unit: %
Trend description of the selected indicator
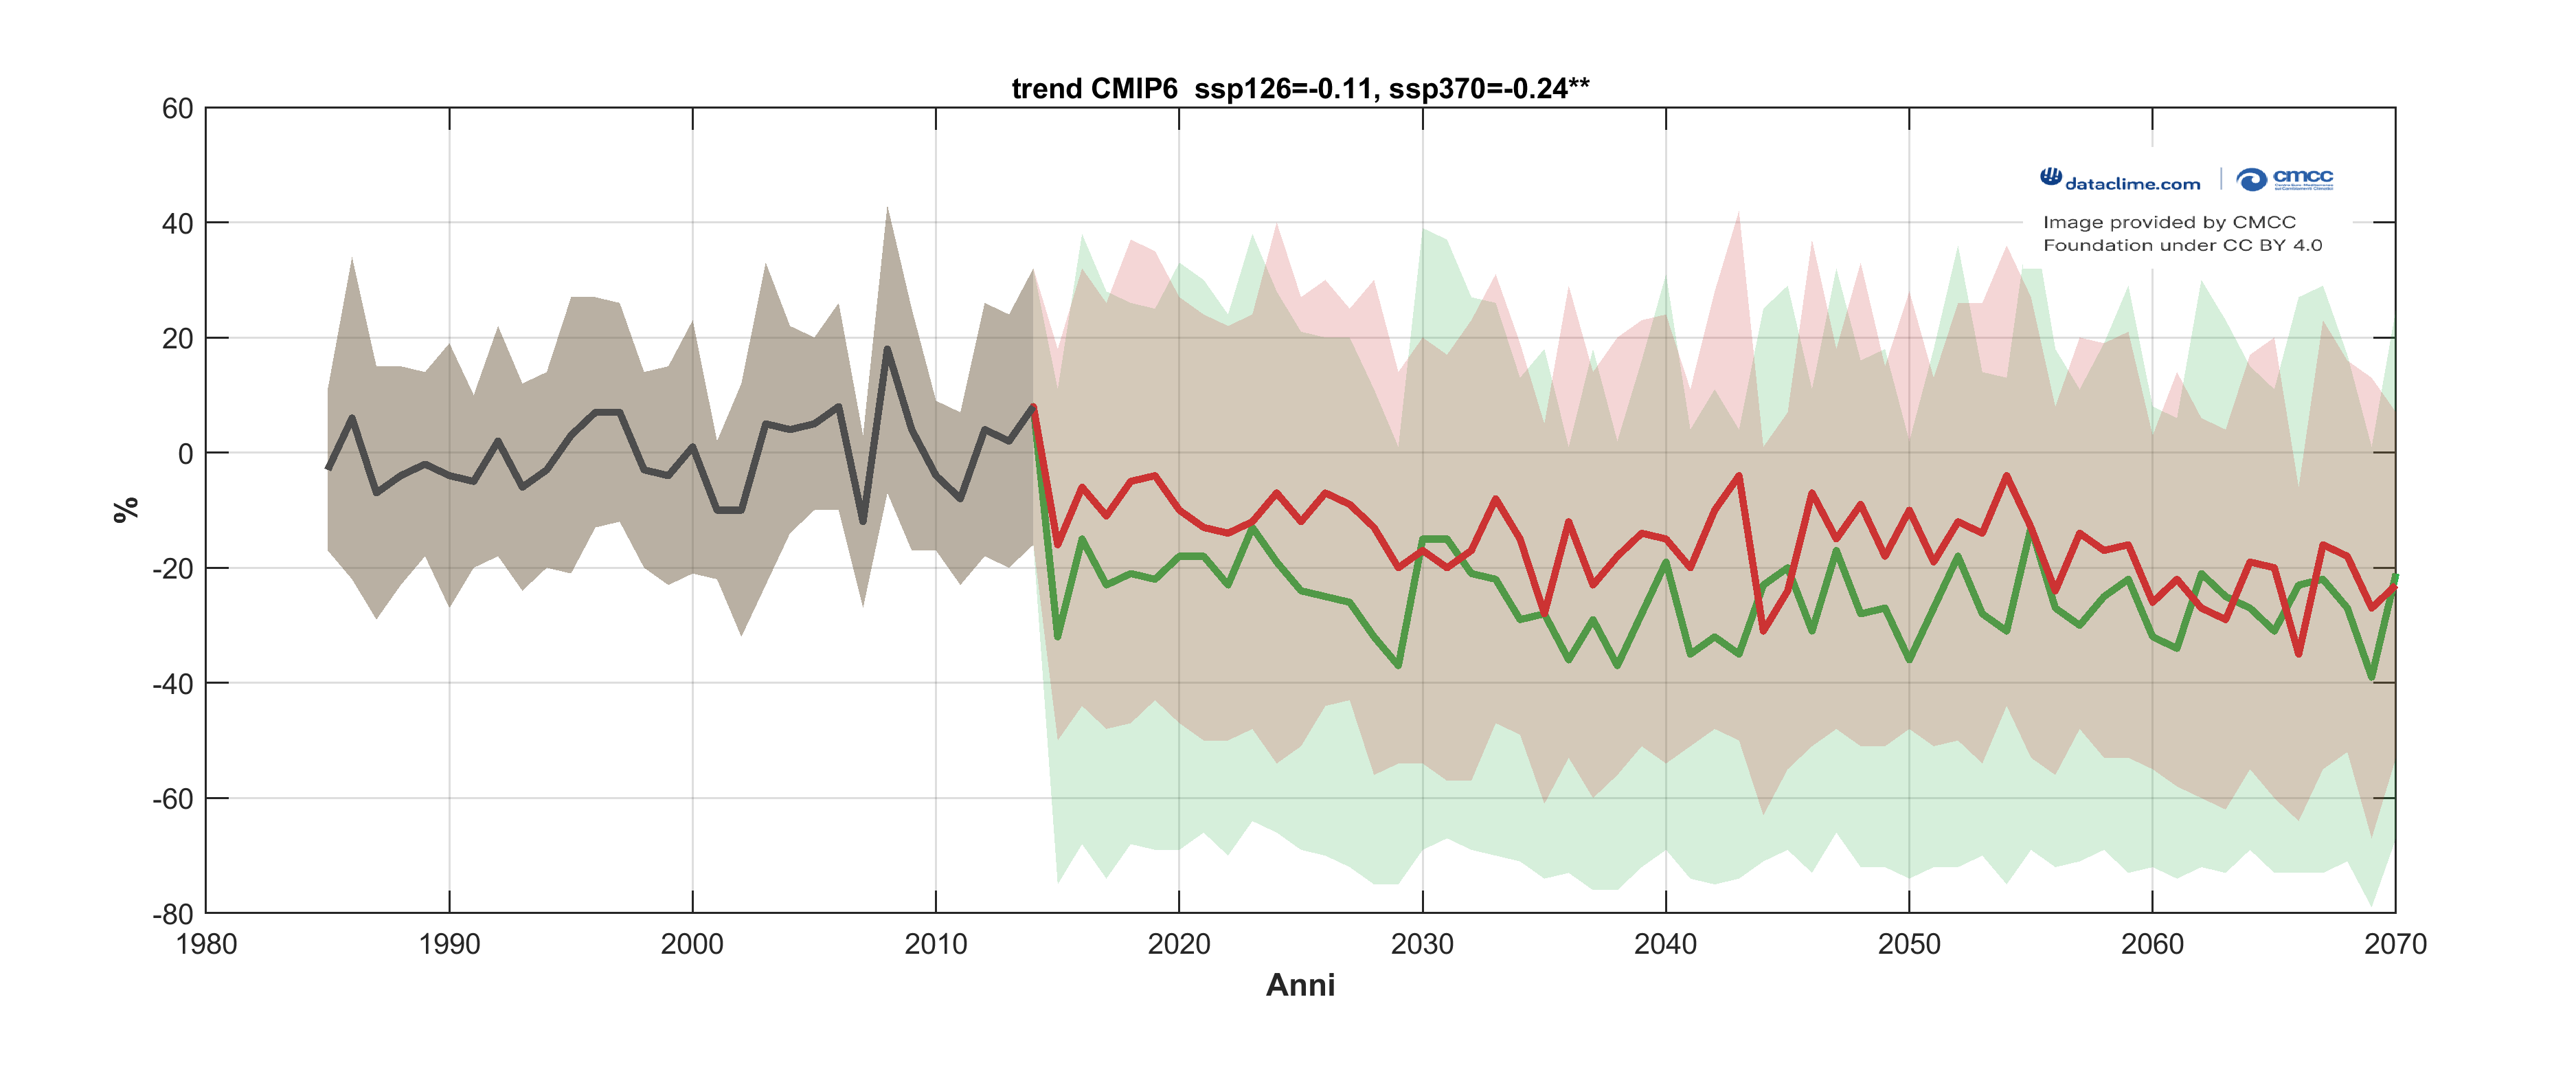
Annual anomalies obtained from EURO-CORDEX models, considering the historical period (in grey) and the scenarios RCP8.5 (in red), RCP4.5 (in blue) and RCP2.6 (in green). Annual anomalies are calculated against the average value for the reference period 1976-2005.
Regional trend
| SSP 126 | SSP 370 |
|---|---|
| -0.11 | -0.24** |
Moving average of the selected indicator
This graph shows the evolution of the moving climate variation of the indicator compared to the reference period 1981-2010. Each point represents the change calculated over a thirty-year period centered on the corresponding year. The coloured lines indicate future climate projections obtained from EURO-CORDEX models for the three scenarios: RCP8.5 (in red), RCP4.5 (in blue) and RCP2.6 (in green). Shaded areas represent the standard deviation associated with each scenario. The graph allows you to view future projections up to 2070, highlighting how the selected climate indicator deviates from the reference value over time.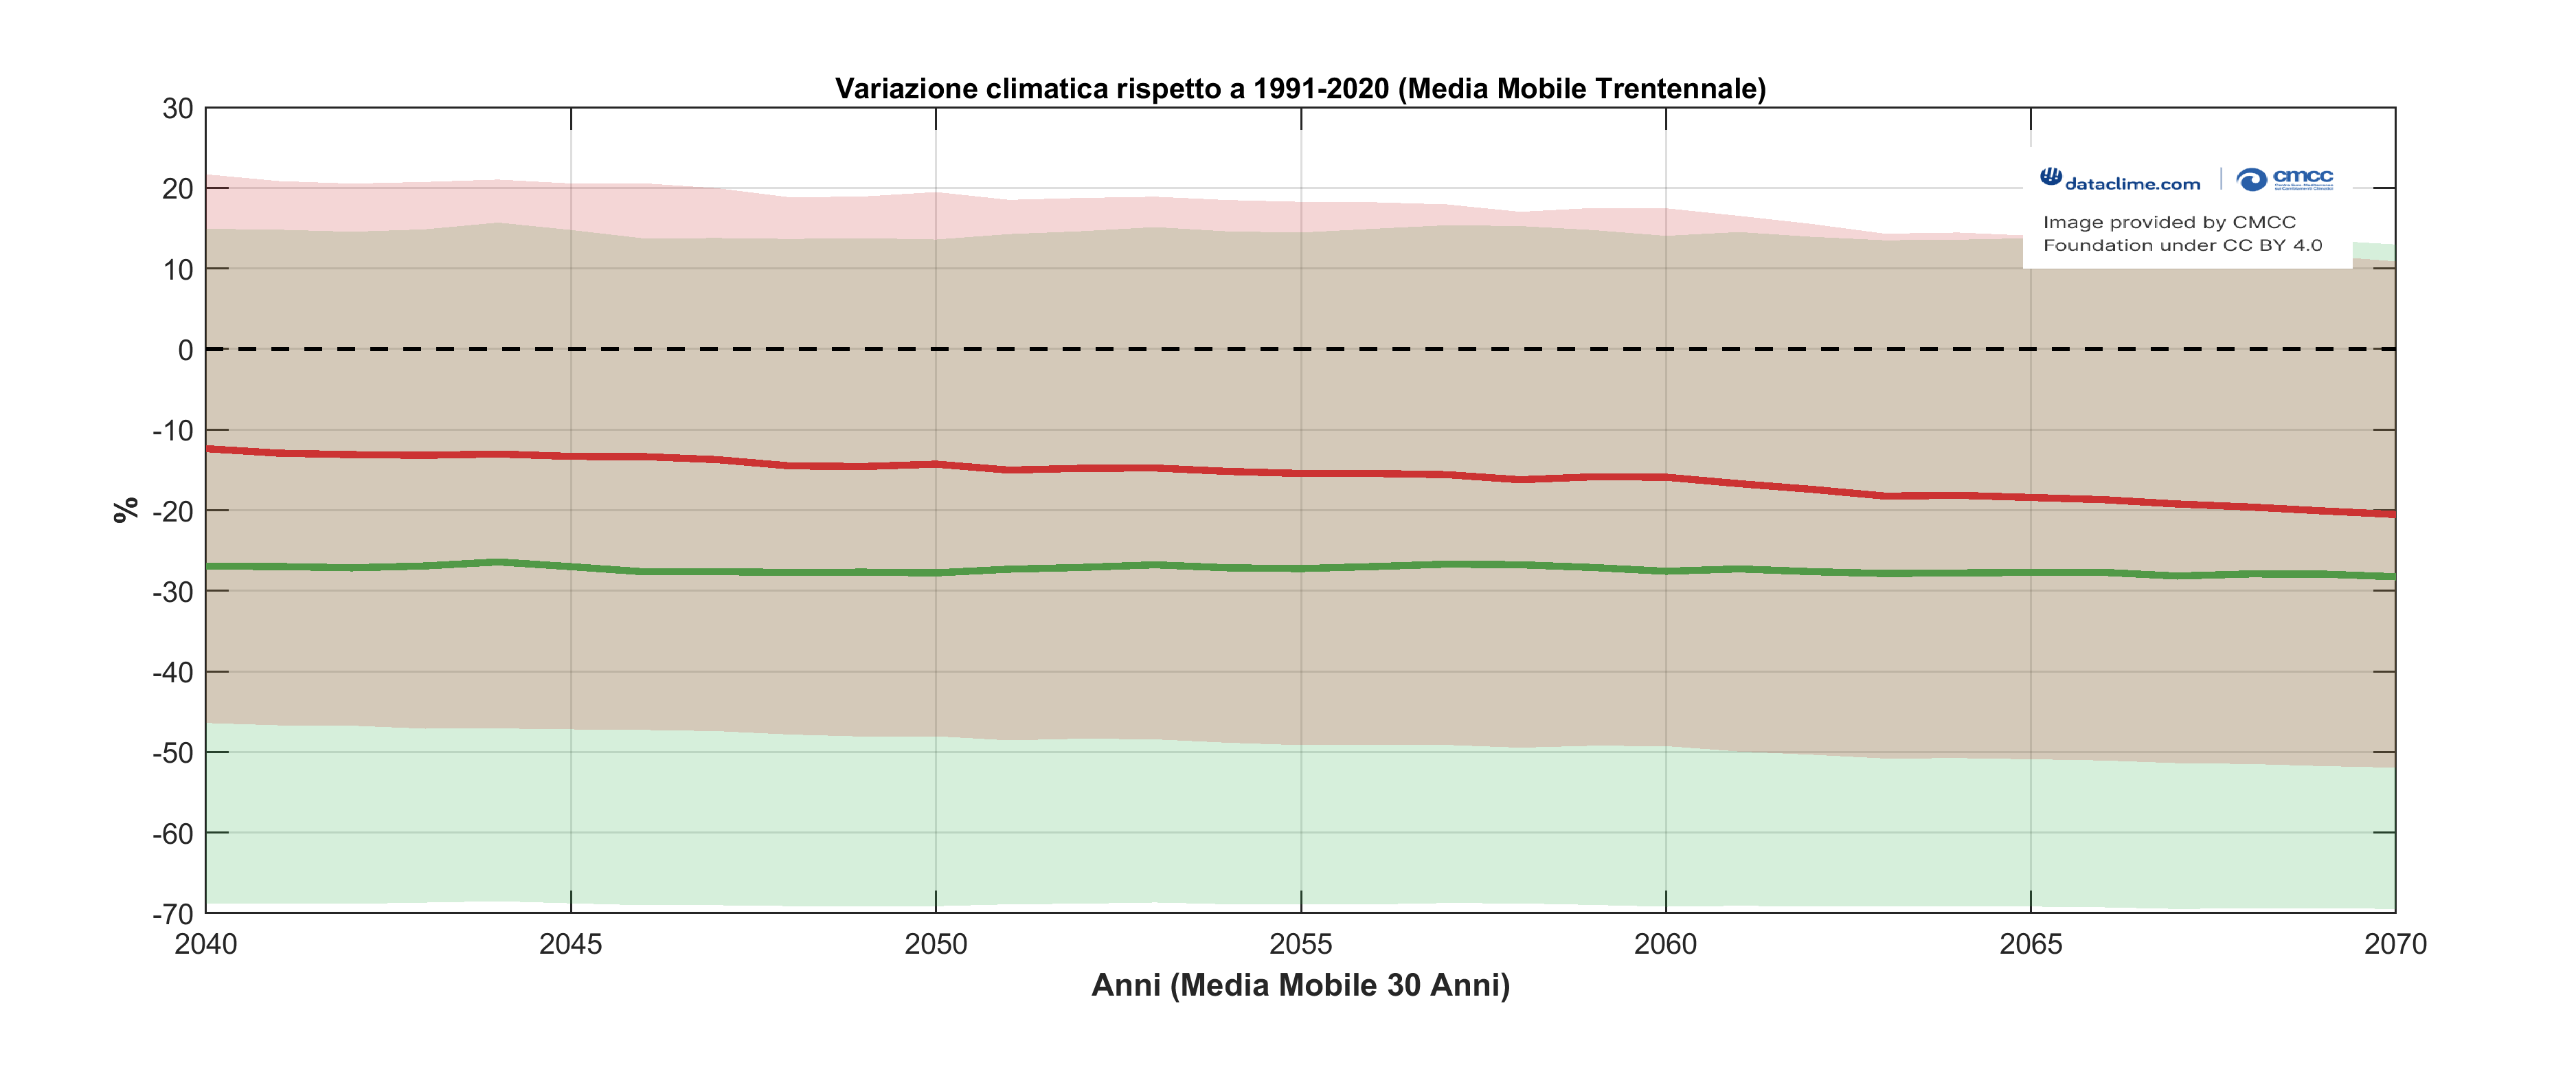
Download the selected map in Zip format.
Cite Dataclime
Users are kindly requested to mention the use of Dataclime, cite the website www.dataclime.com, the CMCC Foundation and the references listed below in any publication or presentation resulting from the use of this data.
The information provided on this page was generated using the SD-EQM_GCMs_IT
(Statistical Downscaling through Empirical Quantile Mapping for an ensemble of
Global Climate Models over ITaly) dataset available free of charge from the
CMCC DDS
(https://dds.cmcc.it/#/dataset/cmip6-stat-downscaled-over-italy).
Users of this content are encouraged to consult the official sources of CMIP6
(https://wcrp-cmip.org/cmip6),
CERRA (Schimanke et al., 2021), CMCC (Reder et al., 2025) and the CMCC DDS
(https://doi.org/10.25424/cmcc-75s8-a308).
It is important to note that the CMCC Foundation and the Dataclime developers
assume no responsibility for the use, interpretation, or consequences of the
data presented in any material. Users are advised to exercise due diligence in
their applications and interpretations of the data and are encouraged to consult
the official documentation provided by Dataclime and the CMCC Foundation for
citation and acknowledgment guidelines.
The user assumes full responsibility, excluding any form of liability on the
part of the Foundation, for any decision taken and for any direct or indirect
damage that may result from the use of the data and information contained on
this site, and will indemnify and hold the Foundation harmless from any claims
that may be made, including by third parties.